Planning - Unequal Probability - Tiles in a Sock Lesson Plan

Title of Activity Probability for Tiles in a Sock Grade Level 2 + Name Dr. Robert D. Sweetland
Concept Assessment Information
(Concept & misconception source)
Concepts Supporting Information Misconceptions Assessment

The probability of an outcome is the number of specific outcomes out of the total number of all possible outcomes of one event.

  • Each sock has three tiles that are the same size, and one of three colors.
  • Each tile has an equal chance of being drawn.
  • The possible combinations are: all one color, two the same color and one different, three different colors.
  • The more objects of one color, the greater the chance of that color being selected.
  • The more trials, the more accurate the theoretical values that are obtained.
  • I can cause a certain tile to be selected. (think real hard, pick a certain way...).
  • One tile always gets chosen more often.
  • It is magic.

Diagnostic

Have students predict the probability for the sock with three tiles.

Summative

Have students predict the probability for selection of tiles with different combinations.

Generative

Use a spinner with equal partitions of different colors and have the students predict the probability for each colored section to be selected.

A prediction about a set (population) can be made from one or more samples.

  • Each selection increases the possibility of selecting all tiles at least once.
  • Predictions are derived from possibilities.
  • Some possibilities have a better chance of occurring than others.
  • Some possibilities are not likely to happen.
  • Some possibilities are impossible to happen.
  • Accuracy of prediction may be increased with more trials.

Young students might look at their individual data and see the numbers are closer to the actual numbers, than the sum of all the class numbers and not see how the sum can be more accurate.

Diagnostic

How many times do think you would have to pick a tile and put it back into the sock, before you would have a pretty good guess as to the color of the three tiles in the sock?

Summative

Have students predict the number of times they would want to draw for different amounts of tiles.

Generative

Have the students predict the number of times a person would have to call out the colors on it before a person could predict the different colors of the sections accurately.

Concept Conceptualization Activity Information

Activity Objective

Students will make a specific number of random selections with replacement and draw a conclusion about the tile population in a sock.

Materials: for each group (sock), three colored tiles, graphing supplies, pencil, paper, and a display board for the entire class
Exploration Procedure
  1. Ask students if they think they can predict what the population of tiles in a sock is without dumping all of the objects.
  2. Record all ideas on the board.
  3. Ask them to explain how they think their answer is a good one.
  4. Ask if they would like to try.
  5. Show the socks and explain that each sock has identical colored tiles.
  6. Tell the students that they will predict the color of each tile for the sock population.
  7. Divide the class into groups of three.
  8. Outline the following directions on the board.

    Each student will rotate the following roles: selector, counter, recorder.

    Selector: Draws the tile from the sock, announces its color, returns the tile to the sock, and shakes the sock.

    Counter: Keeps track of the number of trials the selector has taken.

    Recorder: Records the color of each tile on the group paper.

    Selector: Returns the tile to the sock.

    Each person selects a tile four (4) times.

    Each group thinks about, discusses the results and then writes a group prediction of the sock population.

  9. Ask someone to repeat the instructions.
  10. Students complete the task.
  11. Cruise the room and observe interactions, note critical comments, answer questions about procedures, and make sure groups record the necessary information.
Invention Activty One
  1. Ask students how to display data.
  2. If students do not know how to arrange data, have each group record the number of each color drawn on a chart with the colors labeled across the bottom, each group’s name on the top and the number of times a certain color was drawn above the color.
  3. Students put their data on the chart and explain how they arrived at their predictions.
  4. Have the students decide more draws would help to obtain a more accurate prediction.
Invention Activy Two
  1. Students will repeat the process with four draws.
  2. Ask students if they think the additional draws will help.
  3. Record all ideas on the board.
  4. Ask them to explain how they think their answer is a good one.
  5. Ask if they would like to try four more draws.
  6. Remind them about the roles listed on the board.
  7. Check for understanding.
  8. Students complete the task.
  9. Cruise the room and observe interactions, note critical comments, answer questions about procedures, and make sure groups record the necessary information.
Invention Activy Three
  1. Ask students how to display the data.
  2. If students do not know how to arrange data, have each group record the number of each color drawn on a chart with the colors labeled across the bottom, each group’s name on the top and the number of times a certain color was drawn above the color.
  3. Students put their data on the chart and explain how they arrived at their predictions.
  4. Ask student what would happen if all the classes data was put on one chart.
  5. Create a class chart by having all students place a colored polka - dot or sticky - notes for each colored tile on a graph.
  6. Have the students explain the graph.
  7. Have students predict the probability for selection of tiles with different combinations.
  8. Demonstrate a sock experiment to the students and ask them to make predictions. Show students a sock and putting 2 red, 1 blue, and 4 yellow into the sock. Then have students write their predictions and explanations for what colors would be most and least likely be drawn.
Discovery Activity

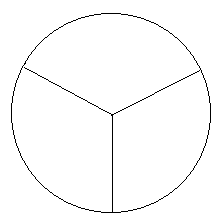
Have students make spinners and tell the probability of different colors. Spinners with equal partitions of different colors can be made and students can predict the probability for each colored section to be selected.

Spinner pattern:

Spinner pattern image


Dr. Robert Sweetland's notes
[Home: thehob.net ]