Nicole Oresme
Father of the modern graph
or as he would say:
the Latitude of Forms
Nicole Oresme was born in northern France in 1323. He read and translated Aristotle's works on ethics and astronomy into French. He was interested in measuring things and is noted for measuring the velocity of a moving object and the temperature at different places in an object.
When comparing velocities of time of an object moving with constant acceleration, like a falling rock, to one that accelerated at a constant rate. He represented moments of time, which he called longitudes, along a horizontal line with bars, each bar representing equal time periods. For each time period (moment) he drew a bar or latitude with the length representing the object's velocity at the moment of the placement of the bar. His graph looked something like this:
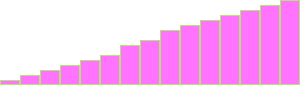
Instead of plotting points he drew bars. Otherwise, it is just like a modern line graph. He writes that his graph has a constant slope and he used them to show equality by comparing the areas.
His ideas took visualization in mathematics beyond the use of sketches, drawings, and constructions of geometry, which are fairly concrete in the nature of what they represent, to being able to visualize more abstract ideas and properties. Like,
- The idea of representing measurable quantities as relate one to another.
- Relating quantities like position, velocity, temperature or brightness to an interval of time.
- Relating time to all the points of another property.
- Making a visual representation of all the values and their relationships.
- The idea of a function. Was new and from the creativity of Nicole Oresme.
In Nicole Oresme's own words:
"Every measurable thing, except numbers, is imagined in the manner of continuous quantity. Therefore, for the mensuration of such a thing, it is necessary that points, lines and surfaces, or their properties be imagined. For in them, as the Philosopher has it, measure or ratio is initially found, while in other things it is recognized by similarity as they are being referred to by the intellect to the geometrical entities. Although indivisible points, or lines, are non-existent, still it is necessary to feign them mathematically for the measures of things and for the understanding of their ratios. Therefore, every intensity which can be acquired successively ought to be imagined by a straight line perpendicularly erected on some point of the space or subject of the intensible thing, e.g. a quality. For whatever ratio is found to exist between intensity and intensity of the same kind, a similar ratio is found to exist between line and line, and vice versa. ... Therefore, the measure of intensities can be fittingly imagined as the measure of lines."
Analyzed by:
- Roughly, he’s saying that all measurable things in the world are either discrete things like whole numbers, or vary continuously.
- Given 2 such measurements, they always have a ratio, one to the other; and the most basic case of this sort of measurement is the length of line segments or the area of surfaces, because 2 lengths or 2 areas have a definite ratio, one to the other. ‘The Philosopher” is Aristotle.
- Points are infinitely small and lines infinitely thin, so they are idealizations.
- ‘Successive’ means a quantity that varies in time f(t).
- The ‘subject’ is the set of points on which the function f is defined, its domain.
- His graph is given by imagining perpendicular lines erected on the domain, like a bar graph. Source
Resource
David Mumford
Archive for Reprints, Notes, Talks, and Blog